Industry Perspective Knowledge Helps Working Professional to Understand Tableau Better
Tableau
A world renowned tool for data visualization used across multiple industries to acquire insights from the data. “Data is the new oil” – is a statement you will hear very often but getting the “refined oil” from this plethora of oil or getting the insights from the data is a task. Tableau makes this task easy and not just that Tableau also helps in representing it in a way which is comprehensive, easy to understand and quick to create.
Tableau provides multiple tools to help your business needs. These tools majorly work on Visual Analysis / Discovery / Self Exploration of Data. This allows users to visually explore data and discover new insights. It provides a much higher degree of data interactivity (filter, compare and correlate) as opposed to pre-defined metrics in Visual Reporting. Visual analysis tools often incorporate forecasting, modeling, and statistical, what-if, and predictive analytics. Tableau is a powerful, flexible application for visually analyzing and communicating information. Connect, Analyze and Share are the 3 simple concepts of Tableau.
Components of Tableau:
- Tableau Desktop
- Tableau Server
- Tableau Prep
- Tableau Online
- Tableau Public
- Tableau Reader
Below are some brief information on commonly used Tableau tools:
- Tableau Desktop: provides data analysis that keeps you in the flow. It’s easy to learn, easy to use, and 10-100x faster than existing solutions. Use your natural ability to see patterns, identify trends and discover visual insights in seconds by creating optimized queries. No wizards, no scripts.
- Tableau Server: Is browser- and mobile-based insight anyone can use. Publish dashboards with Tableau Desktop and share them throughout your organization. It’s easy to set up and even easier to run.
- Tableau Prep: Designed to make preparing your data easy and intuitive. Connect to and combine data from multiple data sources.
These tools are drag and drop tools. So for any user who is willing to learn something new then they can easily pick this tool to enhance their technical quotient. As Tableau is a visualization tool it sits on top of all the data. Or we can say that Tableau is a kind of horizontal which cuts across multiple verticals. These verticals can be Banking and Insurance, Retail, Lifesciences, Telecom and Entertainment, Energy and Resources, Manufacturing etc. and the list goes on. There are ample case studies with different organizations talking about how Tableau helped them with their business and get the enterprise level technical solutions for the challenging issues and problems.
User relevant updates and problem solving approach makes Tableau a go to solution. Users can integrate Tableau with more than 70 different data connections and if there is any connection specific requirement then it can be done with ODBC and JDBC drivers without writing a single line of code. You can also integrate Tableau with Data Science tools like R or Python and add flavors to your analysis. Creating interactive dashboards/webpages on the go makes this tool #1 choice.
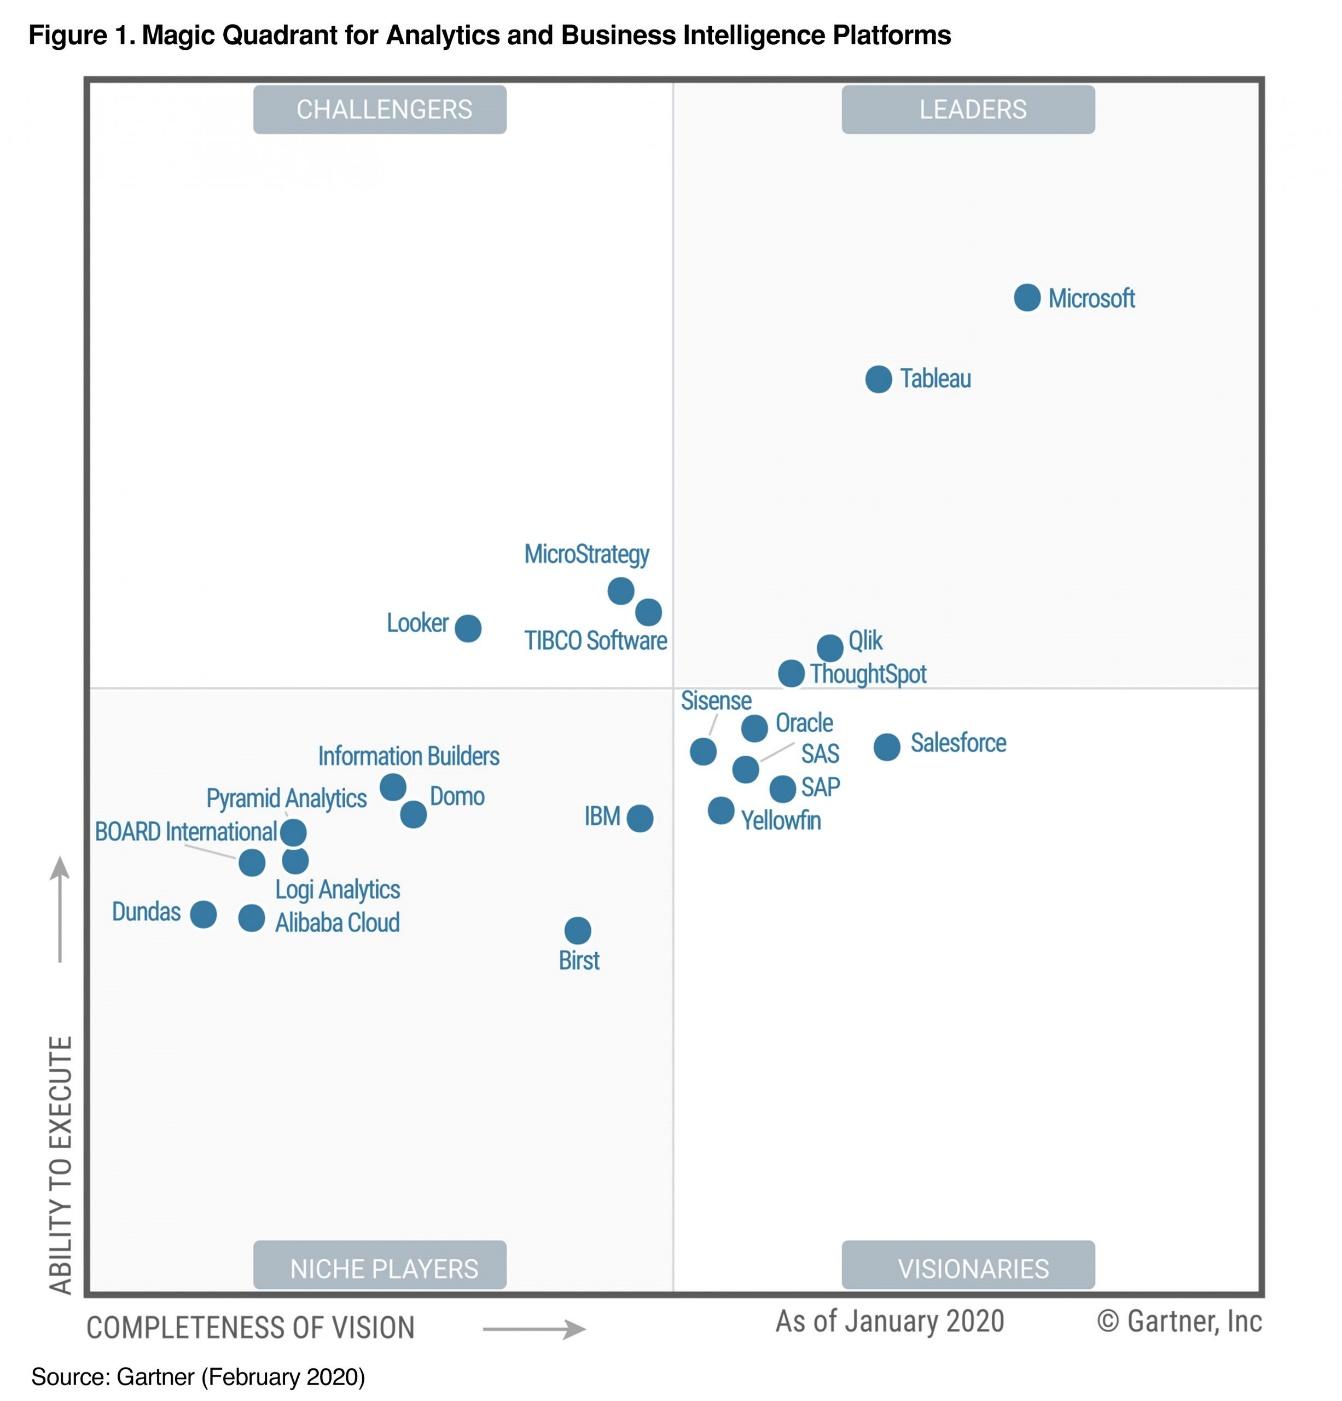
Gartner has dubbed Tableau "the gold standard" in the 2020 Gartner Magic Quadrant for BI and Analytics Report.
Because of these features this tool becomes the first choice for students, data analysts, data science folks etc. Learnwell Technocraft provides Tableau training in Pune by industry experienced instructors. These trainings are meant to give you the next level of exposure for production scenarios and make you market relevant. Practical approach and experience sharing make these sessions interactive, interesting and easy to understand. These courses are designed in a way that it makes you certification ready. Learnwell Technocraft also helps students with resume and interviews.